Build a fast org. With F/AS/T.
F/AS/T: Forward-deployed AI Services and Tech
We show up on your site with experts. We build your custom systems with AI, in weeks not quarters. We run it all on a tech platform underneath — built once, used everywhere.
One vendor, one accountable team — no seams.
Enterprise software breaks down at the seams
Every serious system today is assembled from three vendors — and the risk between them belongs to you.
Sells a license
The vendor is paid whether anyone uses it or not. Software that is bought is not software that is used — shelfware is a business model.
Sells hours
Paid by effort, they profit while the problem persists. Eighteen months later you own custom code nobody maintains.
Sells a deck
Recommendations without running code. The partner leaves before the system exists.
The SI blames the software. The vendor blames adoption. The consultant blamed both and left in March. A F/AS/T company owns all three layers — so the seams are our problem, not yours.
Three layers. One accountable team.
People on your floor
We work inside your business — in your reviews, with your teams, close to the actual work. We discover what needs to change, settle the definitions and stay accountable for adoption. No long specification. No hand-off to a delivery centre. No black box.
You pay a fixed fee per phase, for results delivered — not hours.
Systems built around you
Your workflows. Your definitions. Your integrations. Your agents. Your internal tools. We use AI to build the custom layer on top of a reusable platform base — turning what used to be a year-long systems integration into a phase. AI writes the volume. Our engineers own the result.
You pay for tokens used, passed through at cost — not seats.
The Business OS underneath
Identity. Permissions. Hierarchy. Data. Metrics. Dashboards. Workflows. Integrations. Audit. The common foundations of enterprise software, built once and used everywhere. Every custom system lands on the same base.
You pay an annual subscription, banded by users and data scope.
Your operating numbers
You don’t have a dashboard problem. You have a definition problem.
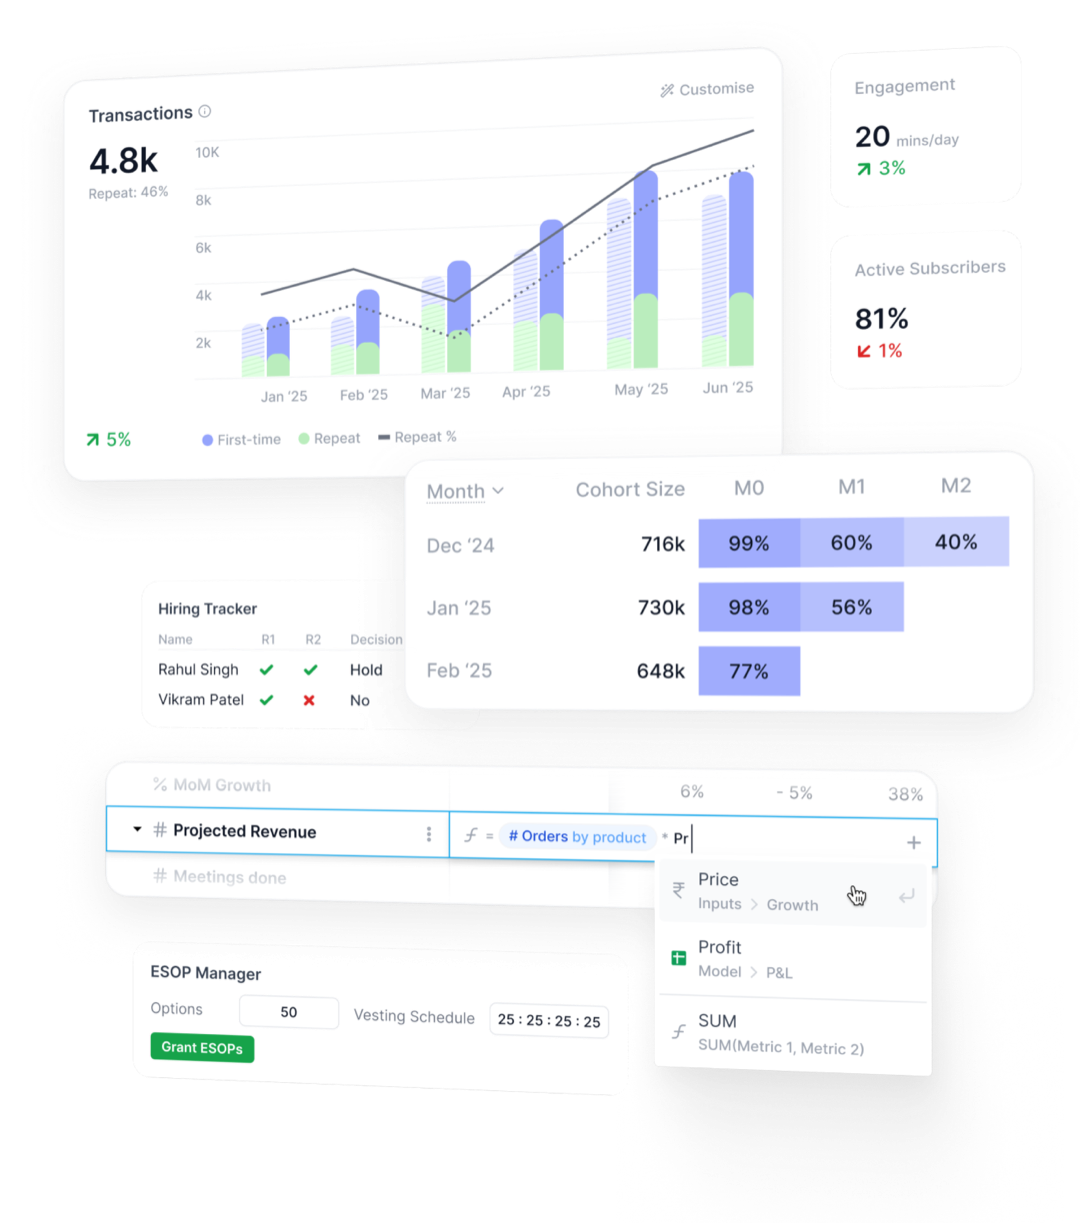
Five teams keep five definitions of the same metric, so no report is trusted and every review becomes an argument. F/AS/T defines every operating metric once, wires it to the systems you already run, and makes it drillable from the board number to a single branch — live, at every level of your hierarchy.
- National
- Zone
- Region
- Area
- Branch
- Field
One definition
Each metric has one formula, agreed with its owners, written down and enforced in code. Disagreements get settled once — not monthly, in meetings.
One owner
Every metric carries a name. Definitions with owners get maintained; definitions without owners drift back into five versions.
Full lineage
Every number traces back to the source system and the rows it came from. “Where did this figure come from?” gets an answer, not a shrug.
Versioned
Definitions change as the business changes. History stays — so last quarter’s board pack still means what it meant when it was presented.
And it isn’t a finance tool or a sales tool. The same layer runs under every function — so the numbers, the plan and the tools finally agree.
- Product
- Engineering
- Sales
- Marketing
- Finance
- People
- Legal
- Investors
Reads from what you already run — core systems, ERP, CRM, HRMS, databases, spreadsheets. Lending stacks are where we’ve gone deepest so far.
The pain scales with branches, field teams and levels of hierarchy — lenders and NBFCs, hospital chains, retail networks, logistics. Who it’s for, in full.
Delivered, not licensed
Our engineers embed with your team, sit in the meetings you already run, and close the gap between buying a tool and running on it — phase by phase.
Executive dashboards
Metric definitions documented and agreed, core systems wired in, production dashboards with drill-down in front of leadership.
Rollout across the organisation
Role-based access for the wider team, people and hiring metrics added, existing internal tools reviewed.
Intelligence and planning
Plain-language questions answered by an AI layer, live plan-vs-actual, scenarios — forward-looking, not just retrospective.
F discovers → AS builds → T absorbs
This is the part that changes everything.
Together they compound: deployment discovers, AI Services builds, the platform absorbs it. The next deployment gets sharper, the next build gets cheaper, and the platform hardens.
Definitions are already settled. Connectors are already built. Patterns are already proven. Mistakes have already been made on someone else’s clock.
The flywheel never resets.
How partners are getting results, fast
A store scorecard in one phase
Store-level sales, staffing and stock in one scorecard, built on the base in a single phase — drill-downs to the outlet, an exceptions workflow on top.
The Monday review that stopped arguing
A consultant and a product manager embed with a lending team whose branches each report collections their own way. Definitions get settled in the room and wired into the review itself.
Adoption as the deliverable
A rollout across sites where earlier dashboards died unused. The team sits in the daily huddles and stays until the huddle runs on the system.
An exceptions agent on the rails
Telematics and job data piped onto the platform, and an agent that reads the same governed definitions to flag the routes that need a human.
The board pack reads from the layer
Monthly reporting moves from a hand-built deck to scorecards computed from one metric layer — so the pack means the same thing every month.
National to store, one truth
The org chart lives in the platform: every figure drills from national to store with ranked lists at each level, every function on the same definitions.
See your numbers in it
You don’t have a dashboard problem — you have a definition problem. Bring one metric your teams disagree on and we’ll show you what settling it looks like: one phase, ninety days, fixed fee.